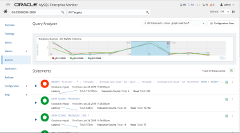
MySQL Query Analyzer
Nur für bestimmte kommerzielle Editionen verfügbar
MySQL Query Analyzer

View Screenshot
MySQL Query Analyzer Detail

View Screenshot
MySQL Query Analyzer EXPLAIN

View Screenshot
The MySQL Query Analyzer enables developers and DBAs to quickly improve the performance of their database applications by monitoring query performance. MySQL Query Analyzer lets you accurately pinpoint SQL code that is the root cause of a slow down. Rich graphs that drill down into detailed query information provide significantly better visibility into database performance issues. With the MySQL Query Analyzer, developers can improve SQL code during active development as well as continuously monitor and tune queries running on production systems.
Improve MySQL Performance: Find and Fix Problem Queries
The MySQL Query Analyzer provides a consolidated view of query activities and execution details enabling developers and DBAs to quickly find performance tuning opportunities. MySQL Query Analyzer enables developers to:
- Quickly identify expensive queries that impact the performance of their applications
- Visualize query activity to gain further insight into performance beyond query statistics
- Filter for specific query problems like full table scans and bad indexes using advanced global search options
- Fix the root causes of poor performance directly in the SQL code
Visually Correlate Query Execution with MySQL Server Activity
Correlated graphs allow developers and DBAs to visually compare MySQL server activity concurrently with executing queries.
- Drag and Select a region on a graph to display the queries being executed during the selected time period
- Combine timeframes with numerous filtering options such as Query Type, Execution Counts, First Seen and more to further target tuning opportunities
Drill Down into Detailed Query Information
Fine-grained query statistics take the guesswork out of finding queries that can be tuned for better performance.
- Query Analyzer Table provides aggregated summary information for all executing queries
- Query Response Time Index (QRTi) identifies queries with unacceptable response times
- Response Statistics provide Execution Time and Row Statistics, Time Span and First Seen
- Example Query provides a sample query for further review
- Explain Query provides insight into the execution plan used for the query
- Graphs provides key metrics such as Execution Time, Executions, Rows, and Kilobytes for a window of time for a specific query
Demos
- Installing MySQL Enterprise Monitor
- Real-time MySQL Performance & Availability Monitoring
- Performance Tuning with MySQL Query Analyzer