MySQL Enterprise Monitor
Disponible uniquement avec les éditions commerciales
MySQL Enterprise Monitor
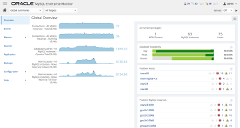
Afficher une capture d'écran
MySQL Query Analyzer
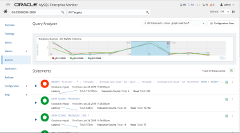
Afficher une capture d'écran
Database File IO
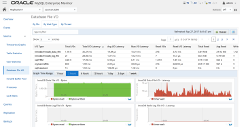
Afficher une capture d'écran
MySQL Replication Topology View
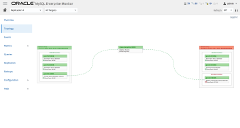
Afficher une capture d'écran
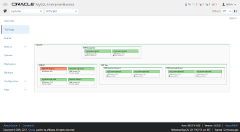
MySQL Cluster Topology View
Afficher une capture d'écran
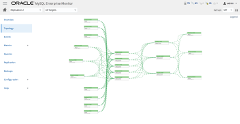
MySQL Replication Multi-Source
Afficher une capture d'écran
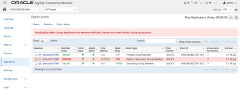
MySQL Replication Status
Afficher une capture d'écran
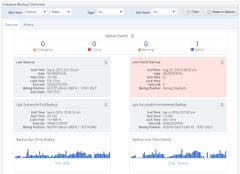
MySQL Enterprise Backup Dashboard
Afficher une capture d'écran
MySQL Enterprise Monitor provides real-time visibility into the performance and availability of all your MySQL databases. Start monitoring MySQL within 10 minutes with zero configuration and no agents.
Modern Look and Feel
A redesigned user interface delivers a vastly improved overall user experience. The visible changes - the layout, the icons, and the overall aesthetics - provide a more natural and intuitive experience. Views dynamically change and adjust to your current context and the assets you've selected, everything from individual MySQL instances or hosts to your custom Groups, to your complex replication and clustered topologies. Additional enhancements include a much more responsive UI and a greater capacity to scale, allowing you to more effectively manage thousands of MySQL related assets.
MySQL Cluster Monitoring
MySQL Enterprise Monitor auto-discovers your MySQL Cluster installations and gives you visibility into the performance, availability, and health of each MySQL instance and NDB process, as well as the health of the MySQL Cluster instance as a single logical system. The Overview dashboard displays detailed instrumentation available for each MySQL Cluster and the Topology dashboard displays the current configuration of your MySQL Cluster enabling you to quickly see the status of the MySQL Cluster instance as a whole and each individual process. The Topology dashboard allows you to easily see how your MySQL Cluster installations are currently functioning.
Replication Dashboard
MySQL Enterprise Monitor auto-discovers your MySQL replication topologies and gives you visibility into the performance, availability, and health of each MySQL instance involved as well as the health of the replication topology as a single logical system. The Replication Status view displays detailed instrumentation available within MySQL and the Topology view displays the current configuration of your Replication topologies, enabling you to quickly see the status of the replication topology as a whole, each individual node, and each replication subsystem. Whether you use Group Replication, InnoDB clusters, any form of Source/Replica setup—from a single-source tree hierarchy, circular replication, or a complex, multi-level, multi-source hierarchy—and any possible combination of them, the Topology view allows you to easily see how your Replication topologies are currently functioning.
Backup Dashboard
The new Backup Dashboard brings deeper integration with MySQL Enterprise Backup and provides key visibility into critical backup activities, allowing you to easily ensure that your most valuable assets are protected against data loss. Visually monitor high level backup metrics for your entire MySQL topology or individual groups, and drill in to view all key metrics and details for individual backups of specific instances. Best Practice Advisors also help you ensure that your backup jobs are running as expected by proactively alerting you when potential problems are detected.
Access Control Lists (ACLs)
Role and group based access controls provide an easy way for MySQL DBAs to define fine-grained security policies for their MySQL servers. Access Control Lists simplify account management for organizations that deploy MySQL Enterprise Monitor in multi-tenant and cloud environments.
MySQL Enterprise Firewall Monitoring
Graphs and Reports make it easy to monitor MySQL Enterprise Firewall activity and protect your MySQL servers against database specific attacks. Best Practice Advisors alert you when a potential security threat has been identified and recommend configuration changes to your Firewall and related security settings.
MySQL Enterprise Audit Monitoring
Monitor and enforce MySQL Enterprise Audit usage across all of your MySQL servers. Best Practice Advisors help ensure organizations are implementing required corporate security policies to satisfy regulatory compliance such as HIPAA, Sarbanes-Oxley, and the PCI Data Security Standard.
Real-time MySQL Performance Monitoring and Alerts
MySQL Enterprise Monitor continuously monitors MySQL queries and performance related server metrics. Receive alerts on significant deviations from the baseline performance trends, and best practice Advisors recommend changes to configuration and variable settings to improve performance.
Real-time MySQL Availability Monitoring
Database availability monitoring and measurement lets developers and DBAs know if they are meeting their Service Level Agreement (SLA) commitments.
Visually Manage All Your MySQL Servers
The Visual Dashboard is a web-based interface and provides an in-depth global view into the database performance, availability, critical events and more. Visually examine a single server, a custom group, or all servers. A rich set of real time and historical graphs allow you to drill down into server statistic details.
Visual Query Analysis
Monitor real-time query performance, check execution statistics, filter and pinpoint SQL code that is causing a slow-down. Using the Performance Schema with MySQL Server 5.6, data is gathered directly from the MySQL server without the need for any additional software or configuration.
Find and Fix Expensive Queries
Correlated graphs enable developers and DBAs to compare execution parameters, such as the server load, thread statistics, or RAM usage against the queries that were executing at that time. Simply highlight a time slice on a graph to find the most expensive queries and locate a potential cause for the larger performance issue.
InnoDB Monitoring
Monitor key InnoDB metrics that impact MySQL performance. Receive alerts on inefficient index usage, locking issues and InnoDB buffer pool usage and get hints and tips on how to improve your InnoDB configuration based on the current performance and the analyzed trends.
Disk Monitoring
Trend analysis and projections allow administrators to forecast future capacity requirements. MySQL Enterprise Monitor delivers predictive alerts to operations staff on user defined thresholds such as "Notify me if disk space will run out in 12 months".
Operating System Monitoring
Visually monitor operating system level performance metrics, including load average, CPU usage, RAM usage, Swap usage, Filesystem usage, and Disk IO in real time.
Identify Security Vulnerabilities
MySQL Enterprise Monitor protects MySQL Servers and helps developers and DBAs discover and address security holes. The Advisors provide a set of rules designed to enforce MySQL security best practices and alert you to potential vulnerabilities before they impact your system.
Faster Tuning during Development and Testing
Get applications into production faster by significantly reducing the time it takes find performance problems during development and testing. Identify and fix performance problems before your users do.
Demos
- Installing MySQL Enterprise Monitor
- Real-time MySQL Performance & Availability Monitoring
- Performance Tuning with MySQL Query Analyzer
- Remotely Monitor MySQL in the Cloud