MySQL Enterprise Telemetry
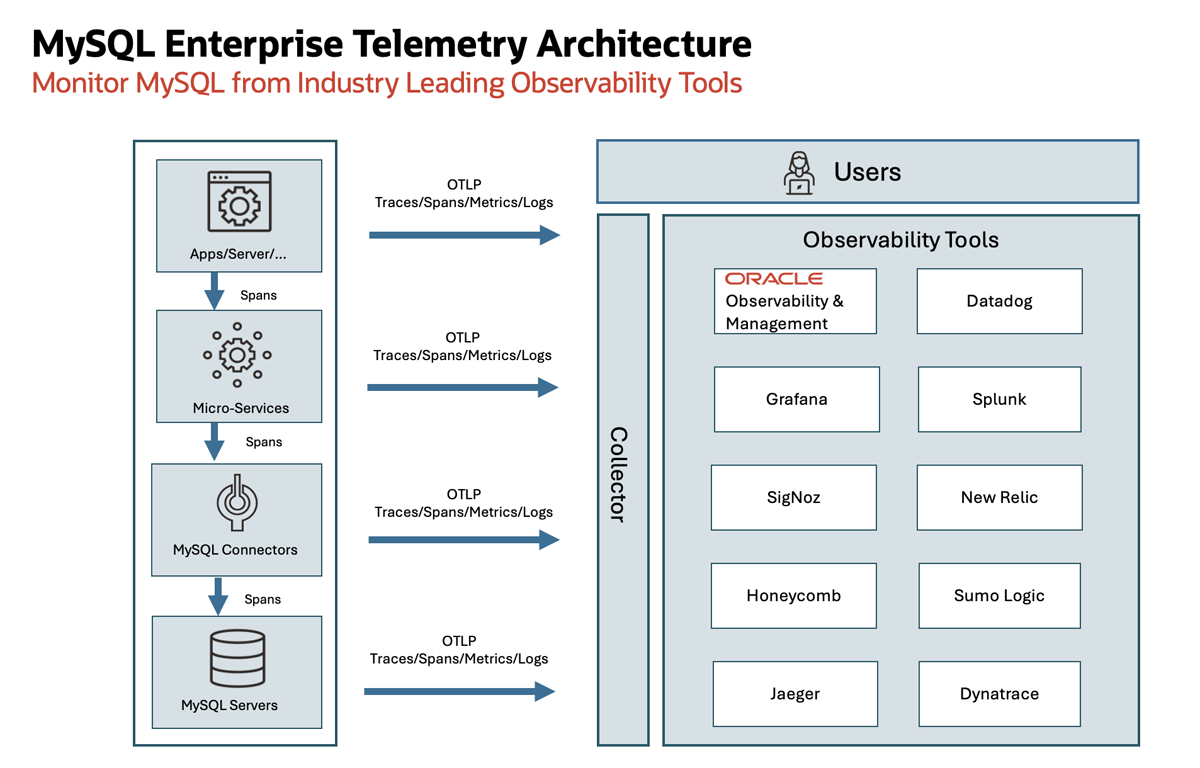
MySQL Enterprise Telemetry allows users to define, create, and collect telemetry data from MySQL to monitor MySQL performance and behavior from a variety of observability and management tools.
MySQL provides telemetry data, such as traces and metrics, using the CNCF (Cloud Native Compute Foundation) OpenTelemetry observability framework– a vendor neutral standard that includes common libraries, protocols and tools.
Traces
Telemetry tracing provides a holistic view of how your entire system operates all the way to the MySQL Database level. OpenTelemetry traces offer several valuable benefits for users of MySQL Enterprise Telemetry:
- Improved Debugging - Reveals the entire journey of a request, pinpointing bottlenecks and errors, helping identify issues faster and with more context.
- Simplified Troubleshooting and Incident resolution - Tracing lets you track the request across apps, microservices to the database, pinpointing the root cause within the specific service that's malfunctioning.
- Performance optimization - By visualizing request flows, you can spot the slowest requests.
- Database Performance Analysis - Reveals how long requests spend interacting within the MySQL database, helping you identify slow database queries to optimize for improved performance.
Metrics
MySQL Enterprise Telemetry metrics are highly configurable allowing users to specify what to send from over 300 MySQL gauges and counters. Metrics can easily be enabled and disabled and timing intervals for exporting metrics from MySQL can be customized.
OpenTelemetry metrics offer several valuable benefits for users of MySQL Enterprise Telemetry:
- Quantifiable Performance Measurement - Metrics precisely measure various aspects of database performance. Allowing for evaluation and identification of bottlenecks or opportunities for optimization.
- Detailed Insights - Metrics can capture a wide range of data points, including database connection counts, query execution times, cache hit rates, and more. This detailed information provides a deeper understanding of how the database is functioning.
- Proactive Monitoring - By continuously collecting and analyzing metrics, you can proactively identify potential issues before they impact user experience. This enables preventative maintenance and ensures optimal database performance.
- Trend Analysis - Over time, metrics data can be used to identify trends and patterns. This allows you to forecast future resource needs and make data-driven decisions for database scaling or optimization.
- Correlation with Tracing Data - When used in conjunction with tracing data, metrics provide a holistic view of database behavior. You can correlate specific metrics with trace data to pinpoint the root cause of performance issues or identify queries that consume excessive resources.
MySQL OpenTelemetry metrics equips you with the quantitative data necessary to make informed decisions about your MySQL Enterprise database, ensuring its efficiency, scalability, and optimal user experience.
Logs
MySQL Enterprise Telemetry logs enable you to correlate logs with traces and metrics, providing a richer context for analyzing system behavior. MySQL can directly send log data to the OpenTelemetry Collector using the Direct-to-Collector approach, eliminating the need for log agents. This provides several valuable benefits for users of MySQL Enterprise Telemetry:
- Simplified Log Management - No need for complex log parsing or tailing.
- Improved Performance - Reduced overhead from log collection agents.
- Enhanced Security - Direct transmission of logs to a secure collector.
- Increased Flexibility - Customizable data processing and routing with OpenTelemetry pipelines.